The complex role of surveys, public opinion in PH elections
IMAGE: Daniella Agacer
MANILA, Philippines—As the May 2022 elections draw near, most candidates have already doubled their public—and online—appearances and interaction to woo more voters and add them to their hoard of supporters.
But how can the public gauge how effective these candidates are in their campaigns months prior to the elections?
For the longest time, one way people measure candidates’ performance in their races was through survey results, which visualize the gaps between candidates based on survey participants’ preferences.
However, questions have also been asked throughout previous poll years—are these surveys reliable or accurate? Does it impact election outcomes? Will these surveys influence voter preferences?
In this article, INQUIRER.net will try to answer those questions and shed light on the role of election surveys in the Philippines.
What the recent polls say
Previous presidential surveys by the Social Weather Stations (SWS) and the Pulse Asia Research Inc.—all of which were conducted after the filing of certificates of candidacy (COC)—had already given a glimpse of what many consider as the frontrunners in the race for the presidency.
Surveys by SWS—a non-stock, non-profit, and politically non-partisan research institute that does both public and private surveys—showed that presidential candidate Ferdinand “Bongbong” Marcos Jr. leads in two separate surveys conducted on Oct. 20 to 23, 2021 and the other on Jan. 28 to 31, 2022.
GRAPHICS: Ed Lustan
In the October SWS survey—commissioned by the think tank Stratbase ADR Institute—which was participated by 1,200 registered voters nationwide, the share of the survey participants’ preference for president in the May 2022 elections were:
- Bongbong Marcos: 47 percent
- Leni Robredo: 18 percent
- Isko Moreno Domagoso: 13 percent
- Manny Pacquiao: 9 percent
- Bato dela Rosa: 5 percent
The January survey—also commissioned by the Stratbase ADR Institute—showed almost the same rankings, with the share of 1,200 survey participants’ preference distributed among the following candidates:
- Bongbong Marcos: 50 percent
- Leni Robredo: 19 percent
- Isko Moreno Domagoso: 11 percent
- Manny Pacquiao: 11 percent
- Lacson, Ping: 6 percent
- De Guzman, Leody: 0.3 percent
- Montemayor, Jose: 0.1 percent
- Abella, Ernie: 0.04 percent
- Mangondato, Faisal: 0.04 percent
On the other hand, two separate surveys conducted in December 2021 and January 2022 by Pulse Asia, likewise reflected almost similar rankings among the presidential candidates.
- Marcos Jr. was also the frontrunner in both Pulse Asia presidential surveys, with at least 53 percent and 60 percent out of 2,400 adult respondents each in both surveys.
- He was followed by Robredo in both surveys, with 20 percent in December and 16 percent in January. Tied in the third place were Pacquiao and Moreno with eight percent each in both surveys.
The rest of the list of results on the Dec. and Jan. surveys were:
- Lacson: 6 percent (December survey), 4 percent (January survey)
- Mangondato: 0.3 percent (January survey)
- Abella: 0.05 percent (January survey)
- De Guzman: 0.004 percent (December survey), 0.02 percent (January survey)
READ: Pulse Asia’s December survey: Marcos and Duterte-Carpio team is top choice
READ: Marcos Jr. leads latest Pulse Asia survey for presidential race
However, what do these survey results really tell us?
About presidential polls
First off, there are some factors involved in the surveys—including the questions asked, sample size, and how respondents were chosen—which raise different questions.
The Stratbase ADR Institute-commissioned SWS survey asked respondents the question, “If elections were to take place today, whom would you most probably vote for as president of the Philippines?”
GRAPHICS: Ed Lustan
On the other hand, Pulse Asia presidential surveys asked a fairly similar survey question, “Of the people on the list, whom would you vote for as president of the Philippines if the May 2022 elections were held today and they were candidates?”
Surveys by Pulse Asia have also asked the question, “If the one you chose for president of the Philippines does not continue his/her presidential candidacy, whom would you vote for if the elections were held today and the rest of the list continued to be presidential candidates?”
Aside from the second question asked by the Pulse Asia surveys, the initial questions between Pulse Asia and SWS seemed similar. But, what if it was not the same? Would the difference in wording make a difference?
Wording matters in these presidential polls, according to statistician and senior research fellow of the Philippine Institute for Development Studies (PIDS) Dr. Jose Ramon Albert’s three-part series published by Rappler—which was based on the 20th Jaime V. Ongpin Memorial Lecture on Public Service in Business and Government delivered October last year.
Albert cited a 1941 article by Donald Rugg in Public Opinion Quarterly, which discussed the “split-ballot experiment,” which asked the following questions and had the following results:
- “Do you think that the United States should forbid public speeches against democracy?”: At least 54 percent responded “yes.”
- “Do you think the United States should allow speeches against democracy?”: Around 25 percent said “yes” while 75 percent said “no.”
“While these two questions about allowing or forbidding speeches against democracy seem like mirror images of each other, what turned Rugg’s split-ballot experiment in question wording into a journal article was that they were not. So, which is it then, 54% or 75%?” Albert asked.
On the matter of survey respondents, surveys usually use a sample size of 1,200 respondents with a plus or minus 3 percent margin of error for national percentages—inversely proportional to the square root of the sample size.
The figures are just a portion of the total 65,745,529 total registered voters for the May elections. So why use only 1,200 respondents?
READ: Guide to voting in 2022 polls amid COVID pandemic
“[S]tatistical theory suggests that when we estimate from a proportion of voters in a population, the estimate from a sample has a measure of precision, called the ‘standard error’ that is dependent both on the true value of the proportion and the sample size,” Albert explained.
“[I]f we want to control the margin of error to be 3 percentage points, which means we want to be near the true value within that margin, then we would need a sample size of about 1,111 which, rounded up to the nearest hundred, is 1,200,” he added.
Moreover, he noted that respondents were from four subnational areas: NCR, balance Luzon, Visayas, and Mindanao. Respondents were also of different genders, ages and socioeconomic statuses.
Why is this significant?
According to Mahar Mangahas, SWS president, the sample surveys are significant for identifying the “course of the election race during the campaign, and for explaining the vote, through its correlations with other data from the same poll, like gender, age, education, religion, satisfaction with government performance, and so forth.”
“It is the surveys that show that some candidates appeal strongly to the poor, whereas others appeal to the middle class,” Mangahas explained.
“Some candidates claim they appeal to the youth, while others say they appeal to women. But it is only from opinion research that these claims can be validated,” he added.
Surveys: Predictions?
Perhaps one of the biggest questions surrounding survey results was if it should be considered a prediction or an image of the possible outcome of the elections.
While Marcos Jr. seemed to widen the lead in the presidential race as seen in the most recent Pulse Asia survey, other candidates believe that the numbers could still change as days go by.
Robredo spokesperson, Barry Gutierrez, said in a statement on Feb. 13 that the survey was “too early to capture the impact of the game-changing interviews with GMA, DZRH, and other media outfits.”
“VP Leni’s stellar performance in those interviews, added to the massive rallies that have come out for her during this first week of the official campaign, gave us confidence that she has the clear momentum. We have no doubt this will be reflected in the coming surveys, and of course, on election day,” he said.
Lacson, on the other hand, remained optimistic and said he believed that the figures shown in the survey did not reflect the reality on the ground.
“I can’t believe that I’m just at 4%. It’s different on the ground,” the senator said, adding that he could be wrong.
Pre-election surveys help show who are the frontrunners early in the race. The current results, however, could still change as many more events might take place months before election day.
“Voter sentiments are hardly constant, but survey results, which can be input to campaign strategies, often converge about a month before voting,” Mangahas wrote in an article published by the East Asia Forum.
“Still, the 2022 election outcome is far from set in stone. More drama will arise in the months to come, making any forecast challenging, if not impossible,” he added.
Mangahas has also previously made an almost similar statement in a 2009 paper presented for the Second International Conference on Public Opinion Polls in Cairo, Egypt.
“SWS never contends that a survey of a sample of the votes can judge the accuracy of a full count of the votes,” he said.
“On the contrary, the reverse is true: It is the full count that judges the quality of a sample survey,” he added.
On accuracy
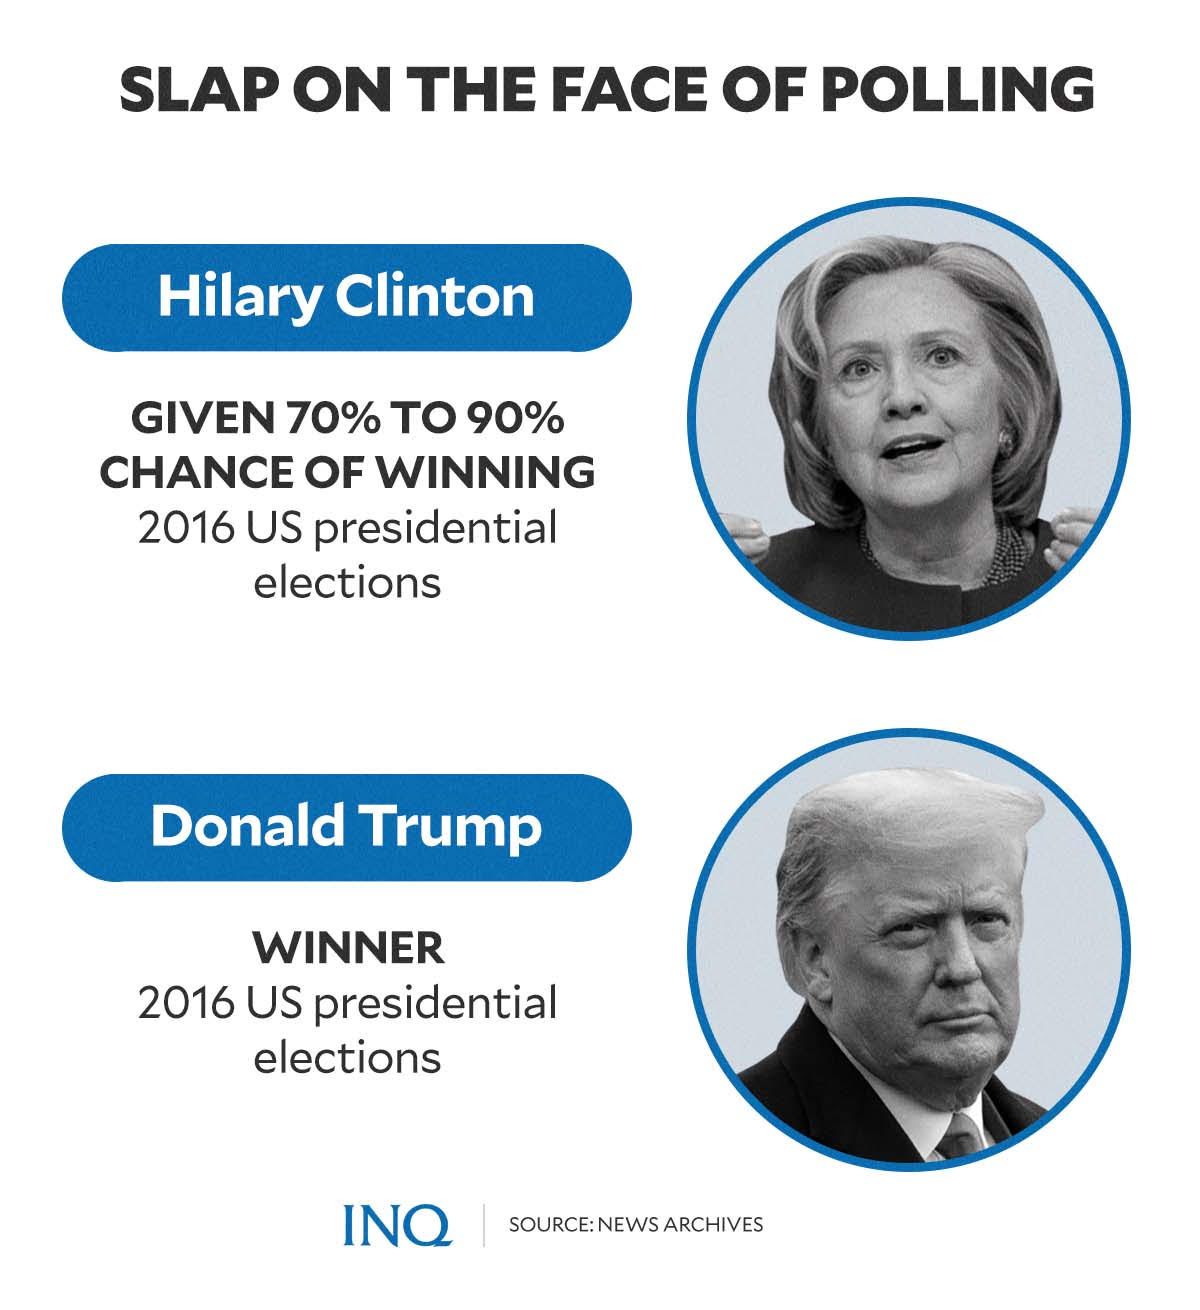
Prior to the 2016 elections in the United States, surveys, forecasters, and even institutions like the New York Times have predicted that then-presidential candidate Hillary Clinton had a 70 to 99 percent chance of winning the race.
However, despite the high estimates, Donald Trump ended up defeating Clinton and even took the majority of votes from the two states—Pennsylvania and Wisconsin—where Clinton was considered a heavy favorite.
According to US-based Pew Research Center, one of the possible factors which might have contributed to the missed forecasts was that some survey respondents were not honest about whom they intended to vote for.
Another factor was the possibility that some survey respondents did not show up to cast their votes.
“[W]e can’t know in advance who is actually going to vote, pollsters develop models predicting who is going to vote and what the electorate will look like on Election Day,” the Pew Research stated.
“This is a notoriously difficult task, and small differences in assumptions can produce sizable differences in election predictions,” it added.
Similar factors, according to Albert, could also affect survey responses in the Philippines.
GRAPHICS: Ed Lustan
“Aside from sampling errors, which result from the use of a sample rather than a full census to estimate attributes of a population, which can be minimized by having a bigger sample, there are also non-sampling errors (also called measurement errors) to contend with,” he said.
“And in the conduct of a survey, these can be potentially affected by six sources of measurement errors,” he added.
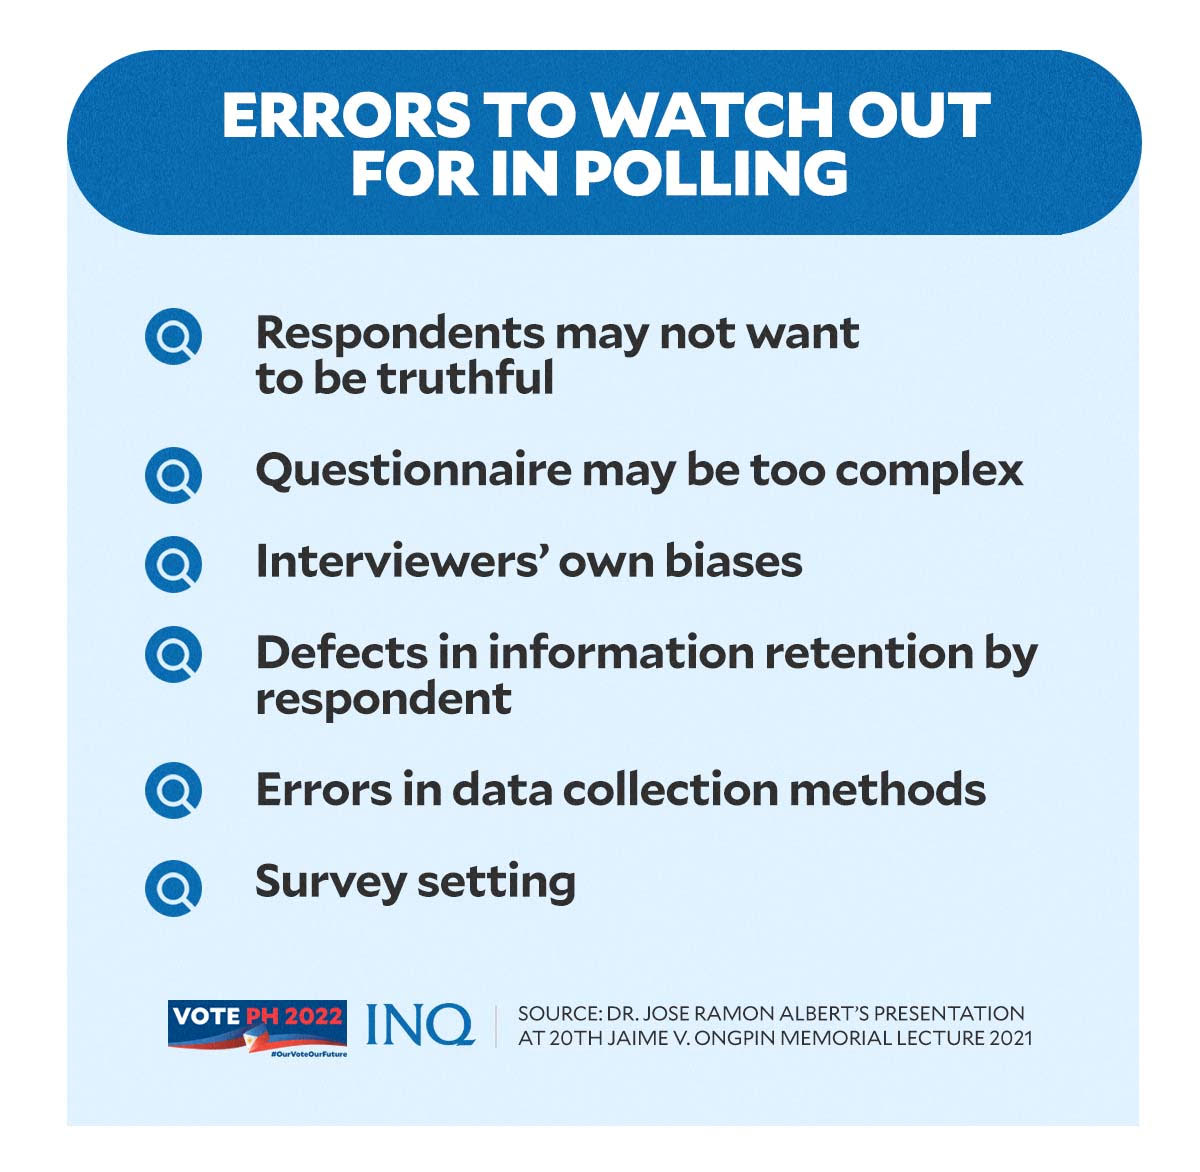
Among the six measurements of errors listed by Albert were:
- the questionnaire may be too complex
- the respondent may not want to be truthful
- the interviewer may influence the responses of a respondent
- “the information system of a respondent, for instance, when asking age, the respondent may have a defective memory, or may not be able to find a birth certificate to validate his age”
- “The mode of data collection”
- “the survey setting”
Impact on public opinion
Mangahas, in his 2009 paper titled “The Challenge of Election Surveys: SWS Experience in the Philippines,” pointed out eight key findings from the SWS surveys done during the 2007 campaign period.
Five of these eight key findings could answer the question of whether election surveys could influence voters and their preferred candidates.
“Command voting,” according to Mangahas, was limited among respondents in the 2007 surveys. Out of every five voters that same year, four said they had their own decisions on who they will vote for.
Meanwhile, only one said that he or she was told by leaders whom to vote for.
Independent influences also overweighed partisan influences on votes.
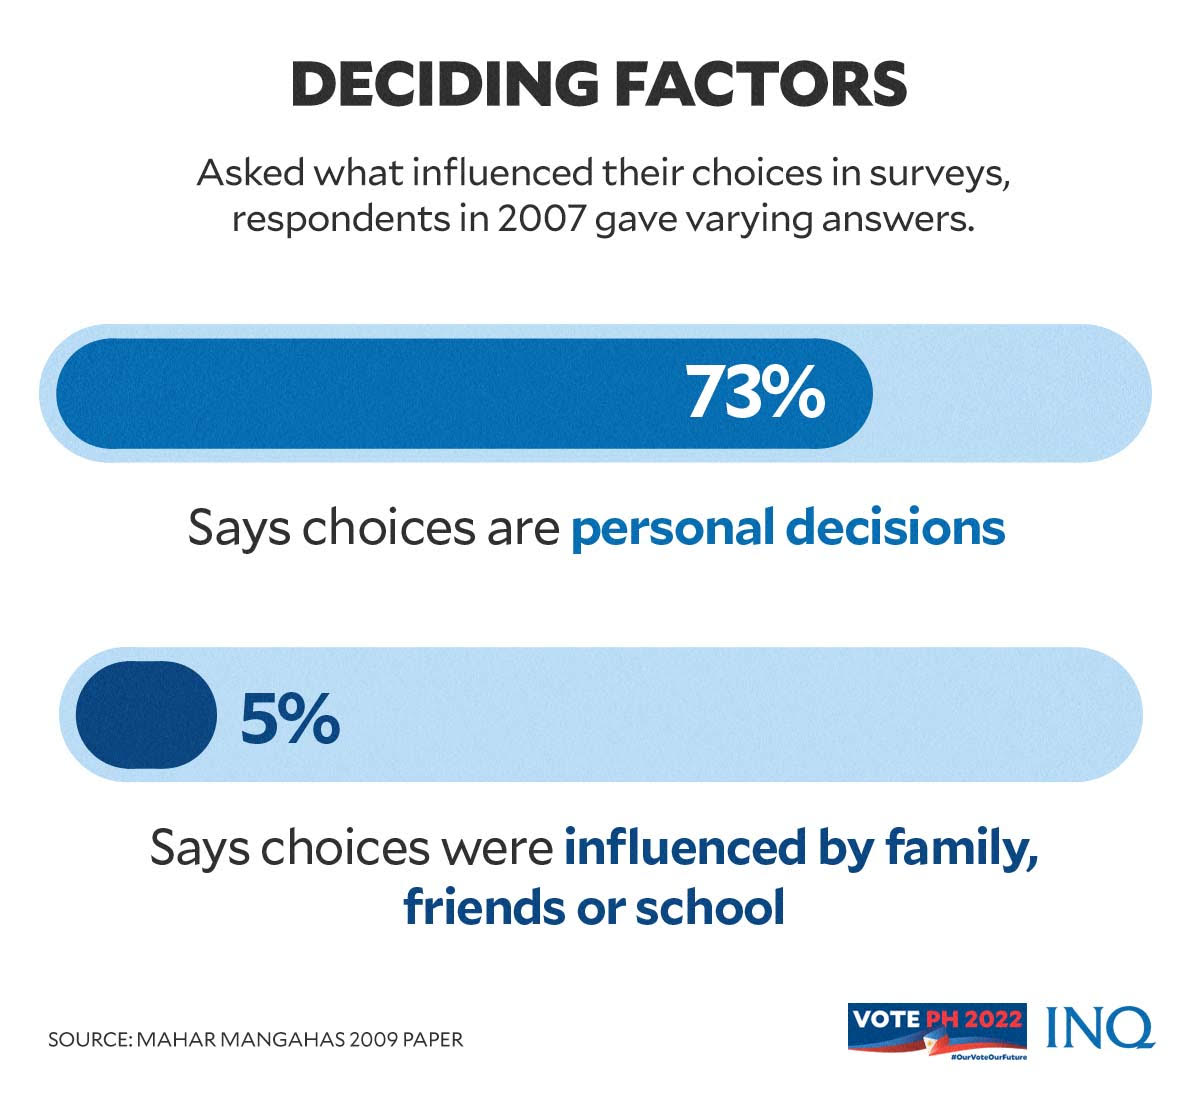
GRAPHICS: Ed Lustan
At least 73 percent of the respondents said their votes were out of a personal decision, while 5 percent were due to influence by family relations, friends, or their school.
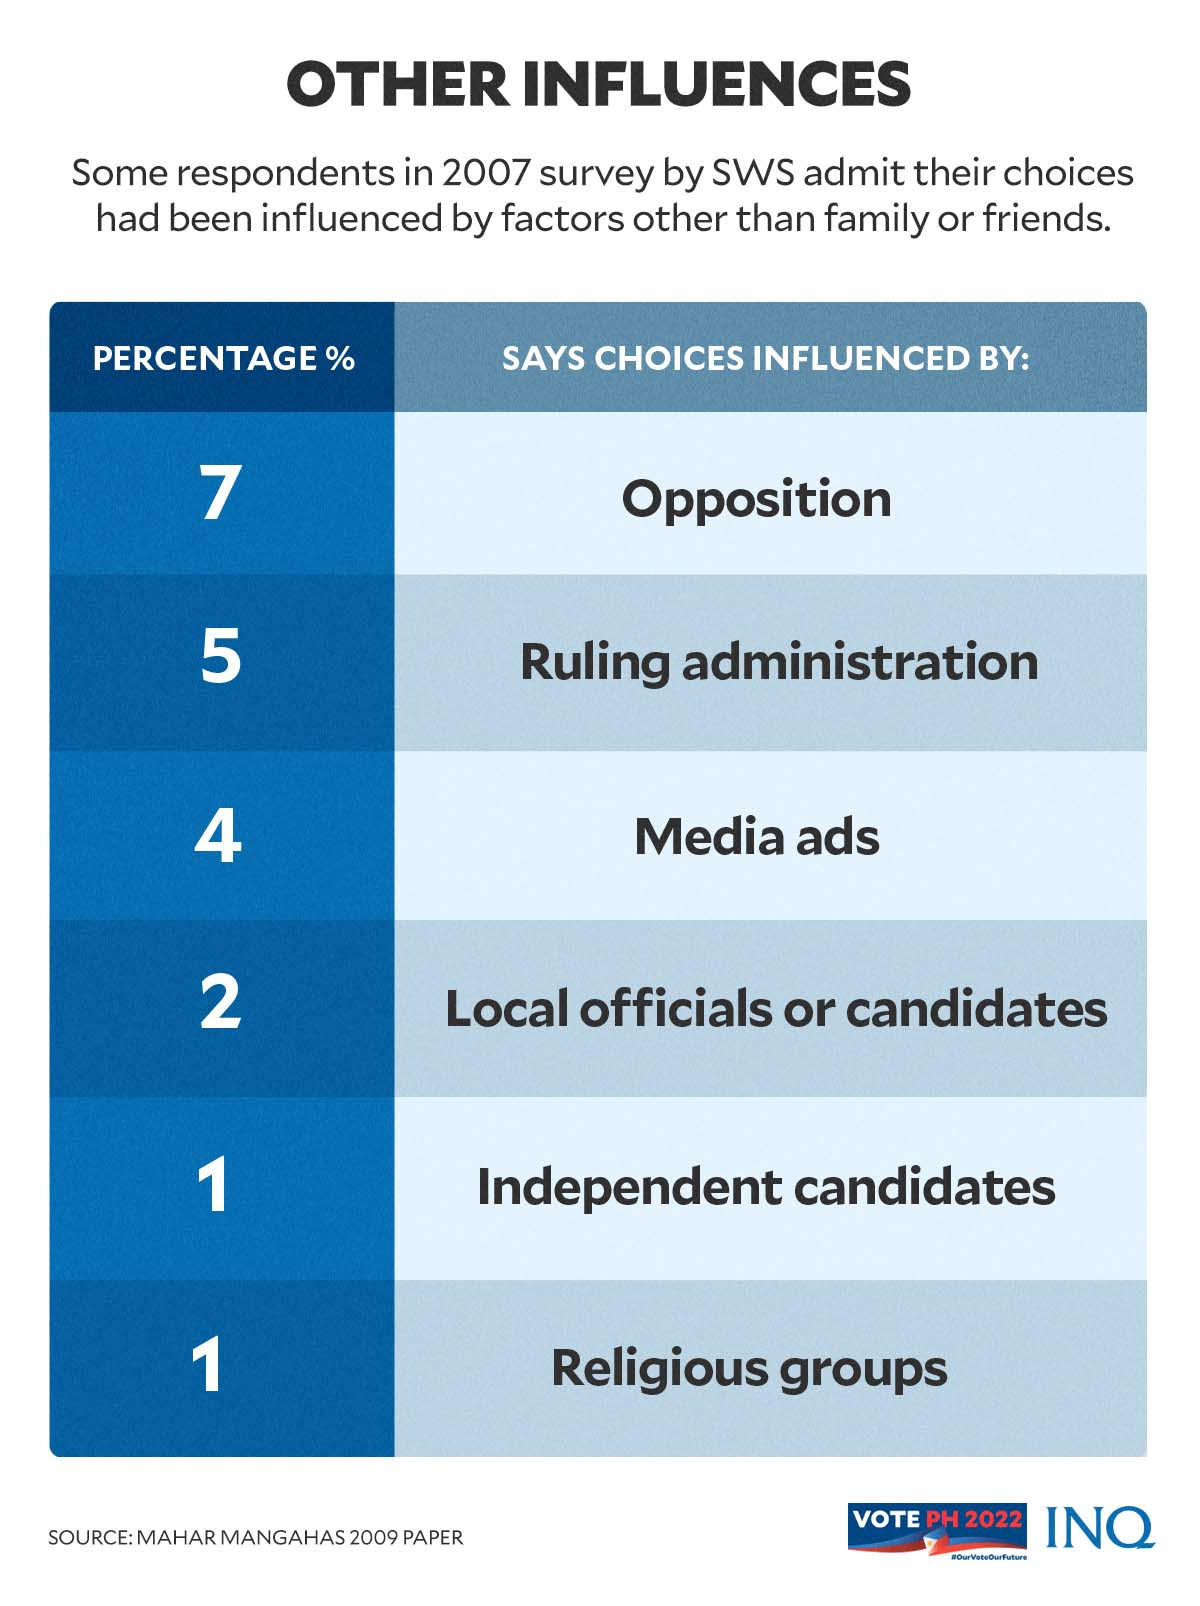
Only 21 percent said their votes or choices were influenced by partisan choices, which included opposition candidates (7 percent), administration candidates (5 percent), media advertisements (4 percent), local officials or candidates (2 percent), independent candidates (1 percent), and religious groups (1 percent.)
Key findings also showed that the majority of respondents take their time to study their choices.
“In a survey done 10 days before the election, 53% said they had made their choices for senator at least four weeks ago, 20% said they had made their choices in the last three weeks, and 24% said they had only just made their choices,” said Mangahas.
GRAPHICS: Ed Lustan
Following the survey, only 24 percent said that they might change their votes from what they told the survey pollster earlier in the interview.
Over half, or 53 percent, said their decision on who to vote for was already definite or similar to who they chose during the survey interview, and 20 percent called it already probable.
Overall, Mangahas clarified that the effect of election surveys—at least in 2009—was small, adding that it “may even be more pro-underdog rather than pro-bandwagon.”
According to previous studies, bandwagon behavior in election surveys pushes respondents or voters to alter their opinion or choices and follow what the majority of the respondents or voters say or choose.
“[Fifty-two percent] (52%) of the voters are unaware of them. 32% are aware but say the surveys have no effect on them,” Mangahas detailed.
“[Eight percent] (8%) said the surveys have influenced them to switch votes partly to favored candidates and partly to underdogs. 5% said the surveys have induced them to switch to underdogs,” he continued.
“Only 3% said the surveys have induced them to switch to favored ones,” he added.
Beyond ‘predicting’ the race
Despite the complex role of election surveys, Pew Research Center said that surveys go far beyond simply predicting the results of the horse race.
“At its best, polling provides an equal voice to everyone and helps to give expression to the public’s needs and wants in ways that elections may be too blunt to do.”