


Charting the cycle of hunger in PH: It’s always there


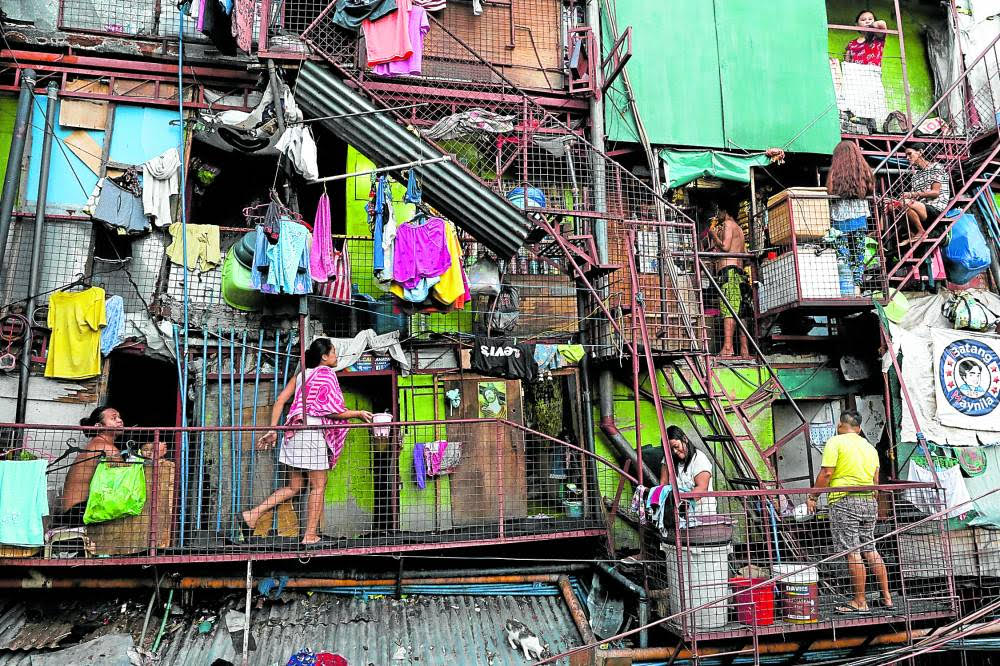
SLUM COMPLEX Residents of a small apartment building in Tondo, Manila, do their house chores outside their units. A Philippine household needs to earn more than P12,082 a month to meet its members’ basic needs. —REUTERS FILE PHOTO
MANILA, Philippines—It was in 2021 when President Rodrigo Duterte said that while it’s easy to promise an end to hunger, the path to fulfilling it was not paved like an expressway.
RELATED STORY: SWS: 3M families experienced hunger in 4th qtr
Duterte said this a year after signing Executive Order No. 101 that created the Inter-Agency Task Force on Zero Hunger (IATF-ZH) to address the reasons people go hungry.
The IATF–ZH was asked to work on a National Food Policy (NFP) as Duterte recognized that hunger, and other problems, continued to be serious concerns.
READ: Duterte forms task force on zero-hunger
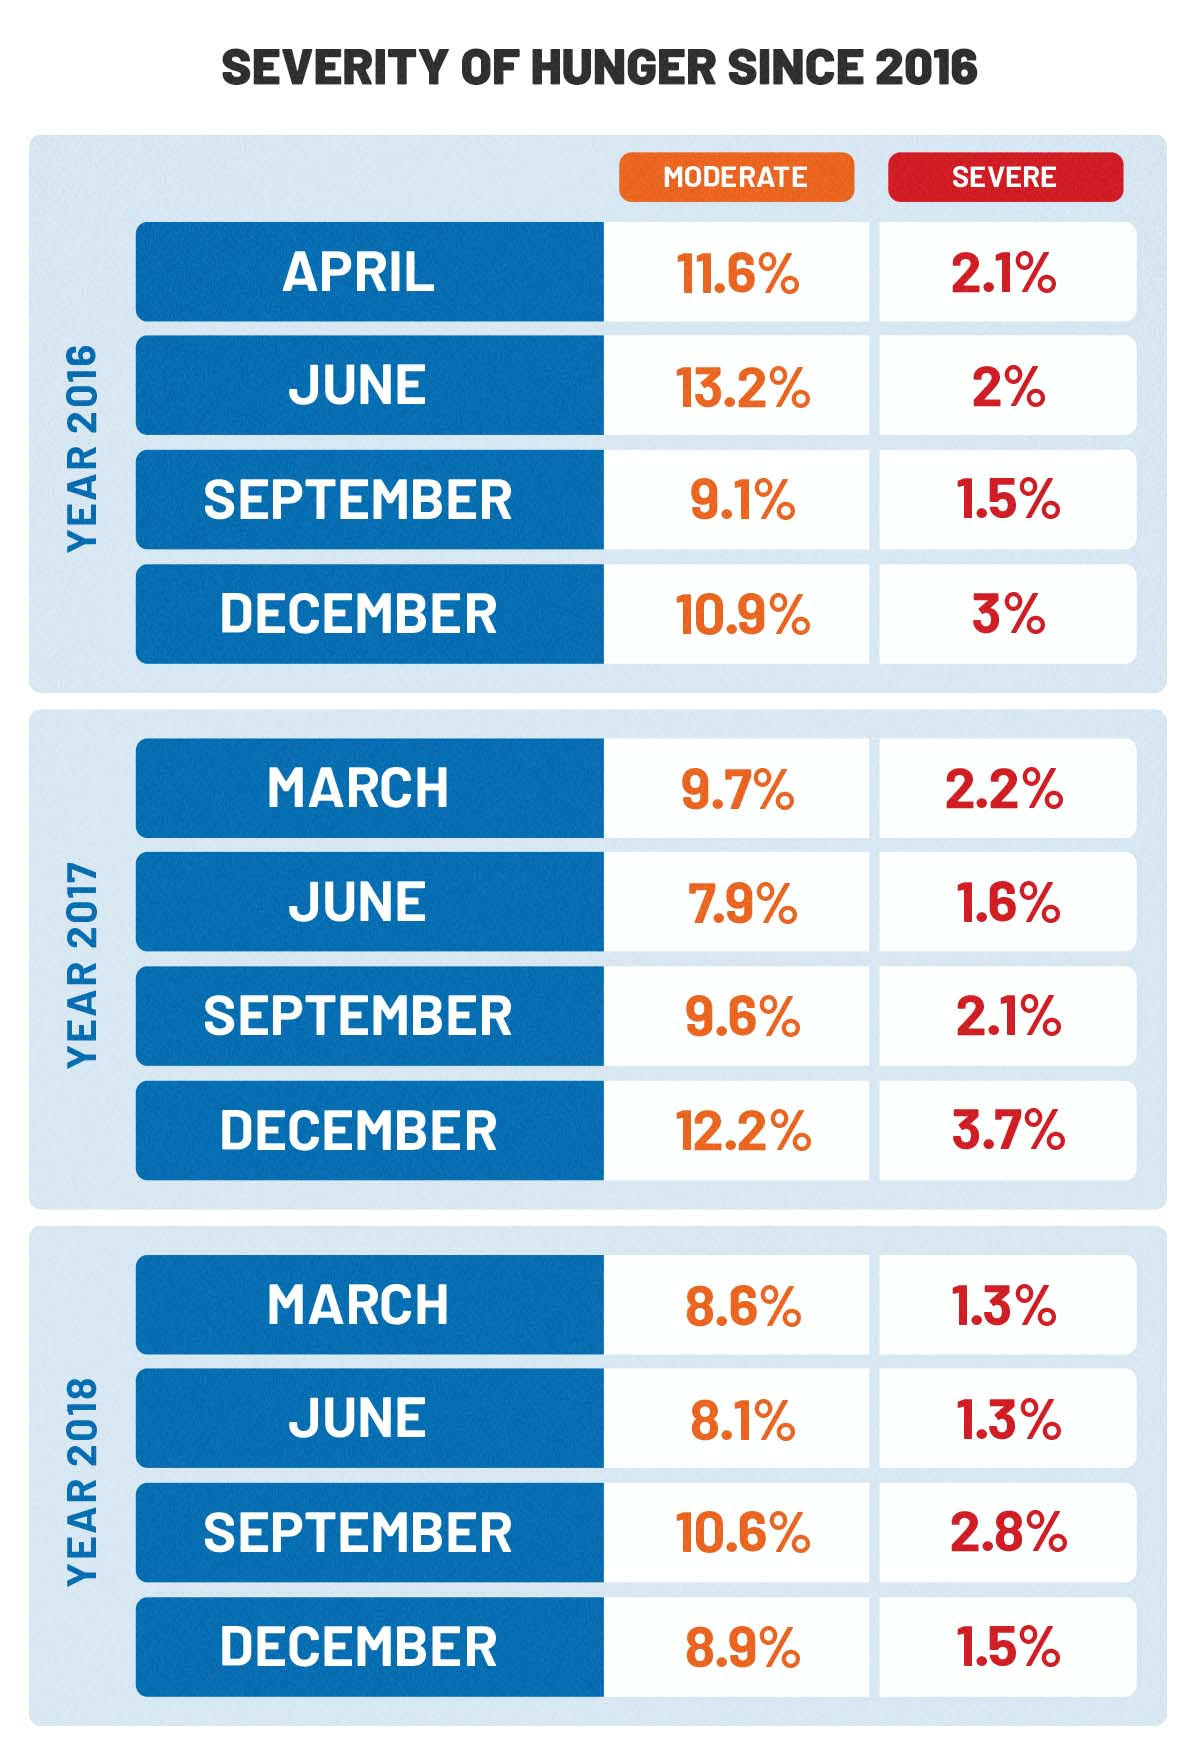
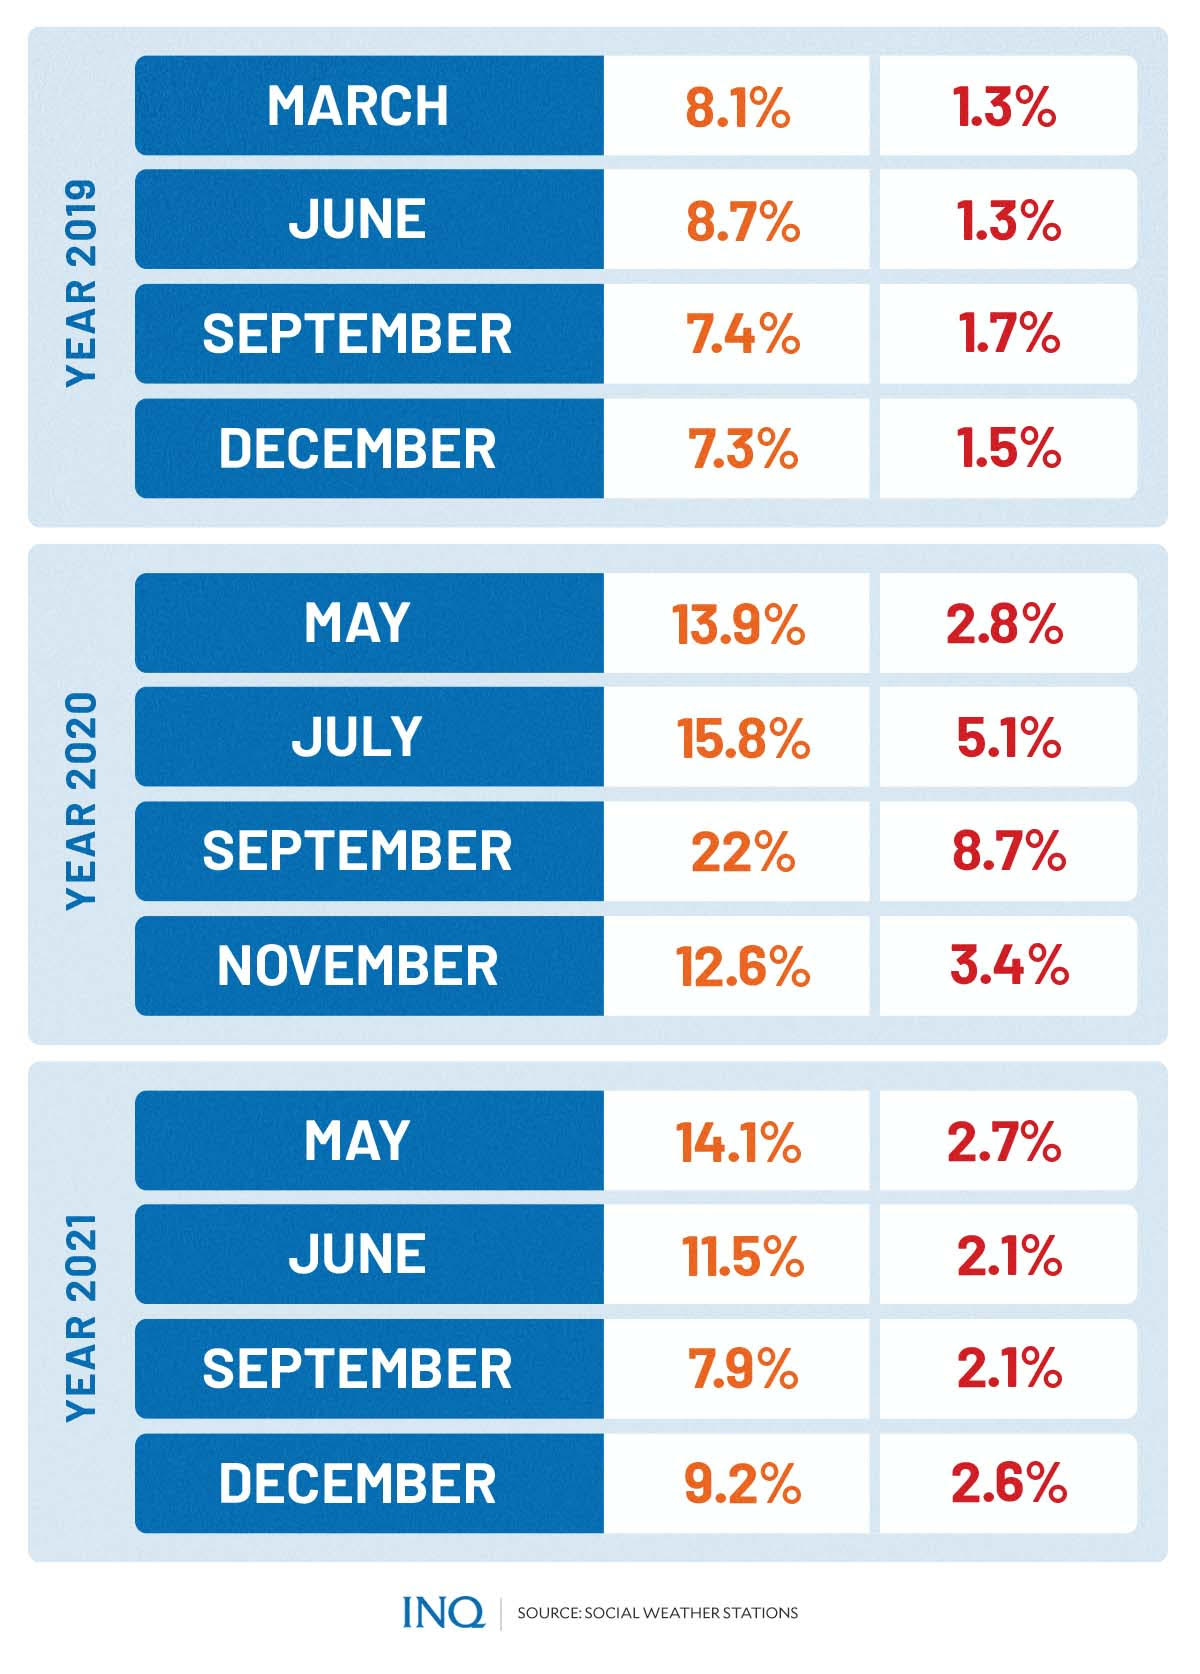
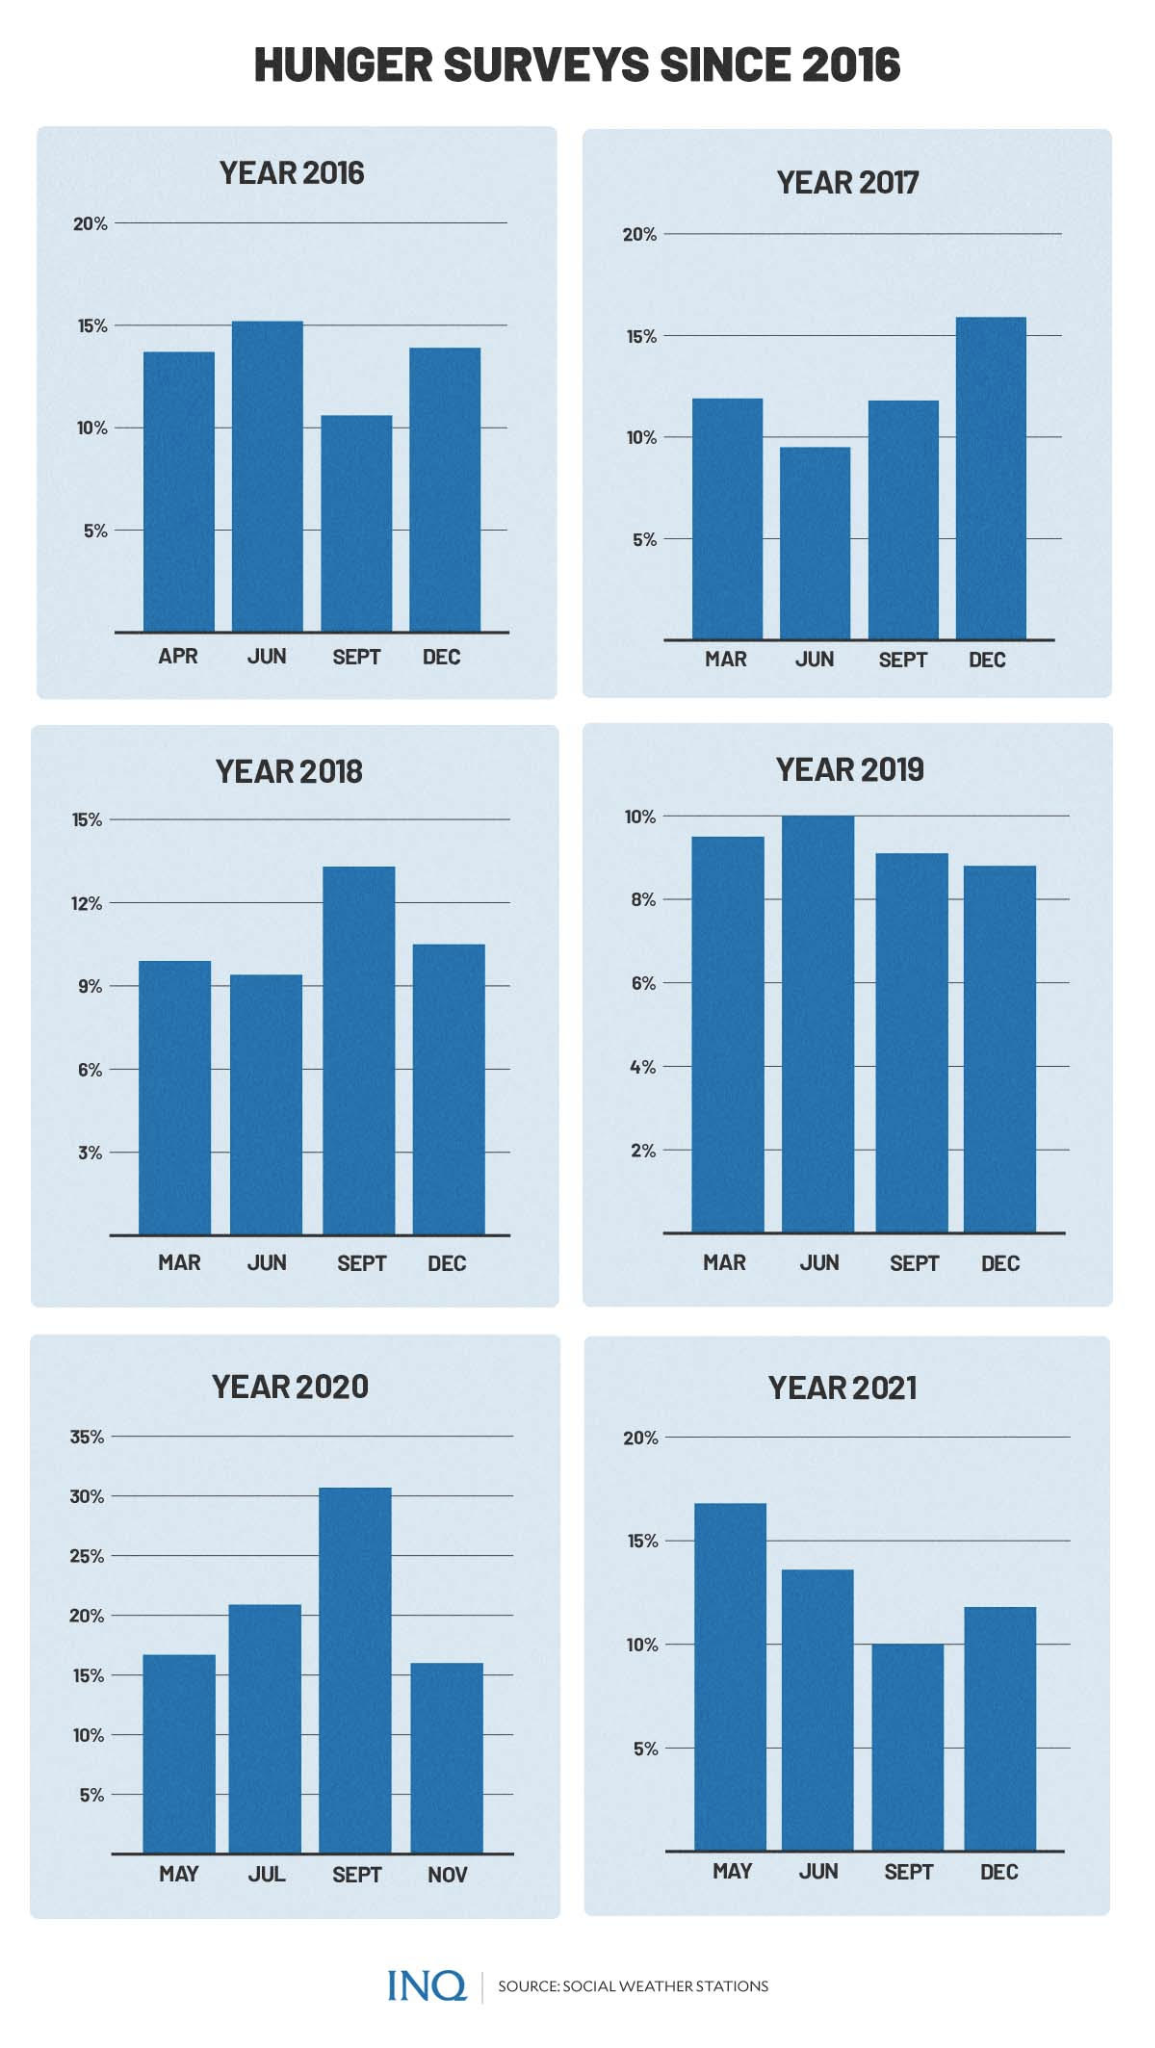
This, as the Social Weather Stations (SWS) revealed in late 2019 (Q4) that 8.8 percent—or 2.1 million—of households experienced hunger—7.3 percent and 1.5 percent had moderate and severe hunger.
READ: SWS: Fewer hungry Pinoys in 4th quarter
It was a 0.3 percent fall from the 9.1 percent—or 2.3 million—households in third quarter 2019—7.4 percent experienced moderate hunger while 1.7 percent had severe hunger.
However, as COVID-19 lockdowns brought an economic standstill, hunger hit 30.7 percent of households in third quarter of 2020–22 percent with moderate hunger and 8.7 percent with severe hunger.
READ: Pandemic sinks PH poor even deeper
GRAPHIC: Ed Lustan
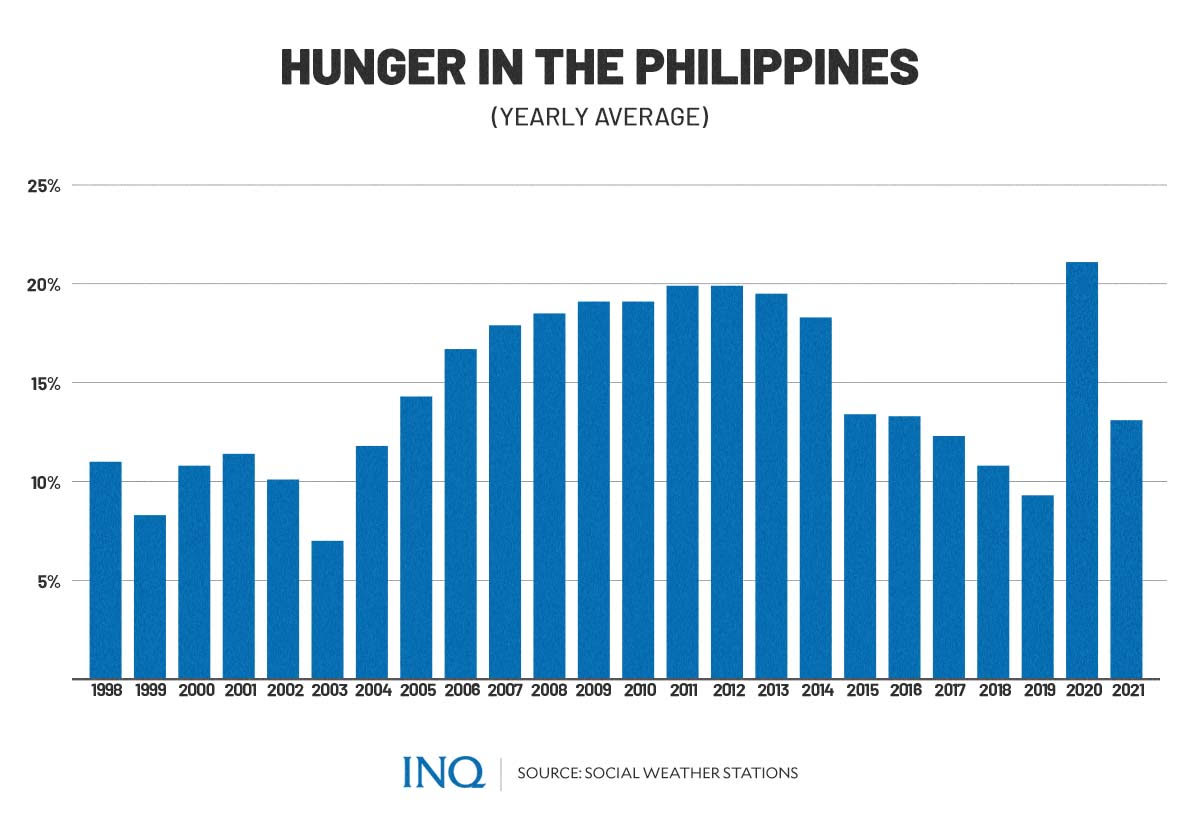
While hunger already fell to 11.8 percent in fourth quarter 2021, last year’s average—13.1 percent—was still well over the 9.3 percent average in 2019, which had been the lowest since 2004:
- 1998: 11 percent
- 1999: 8.3 percent
- 2000: 10.8 percent
- 2001: 11.4 percent
- 2002: 10.1 percent
- 2003: 7 percent
- 2004: 11.8 percent
- 2005: 14.3 percent
- 2006: 16.7 percent
- 2007: 17.9 percent
- 2008: 18.5 percent
- 2009: 19.1 percent
- 2010: 19.1 percent
- 2011: 19.9 percent
- 2012: 19.9 percent
- 2013: 19.5 percent
- 2014: 18.3 percent
- 2015: 13.4 percent
- 2016: 13.3 percent
- 2017: 12.3 percent
- 2018: 10.8 percent
- 2019: 9.3 percent
- 2020: 21.1 percent
- 2021: 13.1 percent
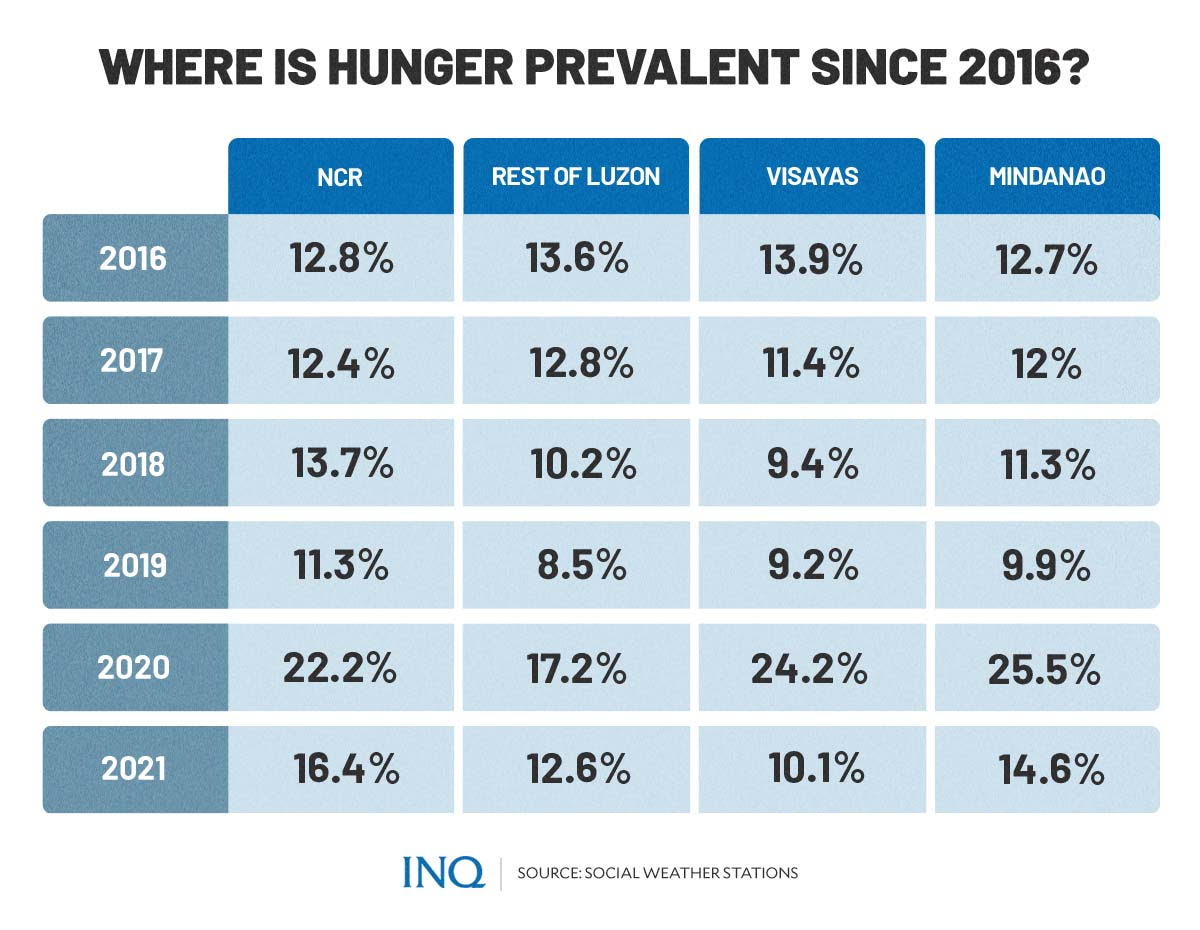
Prevalent
It was in 1998 (Q2) when the SWS decided to ask Filipinos regarding hunger as it saw the serious problem, especially in Mindanao, that year, Mahar Mangahas, president of the SWS, said.
Since then, household heads in Metro Manila, Rest of Luzon, Visayas and Mindanao, were asked regarding the experience of his or her family in the last three months.
GRAPHIC: Ed Lustan
The SWS said that in second quarter 1998, hunger was highest in Mindanao (15.3 percent). Mangahas said because the SWS was highly concerned by this, the polling firm decided to keep it on its “agenda” every three months.
Mangahas said SWS tracks the severity of hunger of a household from responses of household heads on how often they experience hunger or “had nothing to eat”.
The “moderate,” which indicates that hunger was experienced once or a few times, was high in third quarter 2020—22 percent of households:
- 2020 (Q3): 22 percent
- 2009 (Q4): 18.9 percent
- 2008 (Q4): 18.5 percent
- 2010 (Q1): 18.4 percent
- 2007 (Q3): 17.4 percent
- 2011: (Q4): 17.7 percent
- 2014 (Q3): 17.6 percent
- 2011 (Q3): 18 percent
- 2012 (Q1): 18 percent
- 2012 (Q3): 18 percent
The “severe,” which indicates that hunger was experienced often or always, was high in third quarter 2020—8.7 percent:
- 2020 (Q3): 8.7 percent
- 2001 (Q1): 6 percent
- 2012 (Q1): 5.8 percent
- 2000 (Q1): 5.4 percent
- 2013 (Q2): 5.4 percent
- 1998 (Q4): 5.3 percent
- 2008 (Q4): 5.2 percent
- 2020 (Q2): 5.1 percent
- 2000 (Q2): 5 percent
- 2012 (Q2): 4.8 percent
SWS, since second quarter 1998, already conducted 95 surveys on hunger, saying that in the last 24 years, the rate hit a record-low of 5.1 percent in third quarter 2003. Here are the instances when the rate was low:
READ: 95 hunger surveys since 1998
- 2003 (Q3): 5.1 percent
- 1999 (Q3): 6.5 percent
- 2003 (Q2): 6.6 percent
- 2003 (Q1): 6.7 percent
- 2004 (Q1): 7.4 percent
- 1999 (Q1): 7.7 percent
- 1999 (Q2): 8.1 percent
- 2000 (Q3): 8.8 percent
- 2002 (Q3): 8.8 percent
- 2019 (Q4): 8.8 percent)
It was in quarter three 2020 when the rate hit an all-time high of 30.7 percent—22 percent (moderate) and 8.7 percent (severe). Here are the instances when the rate was high:
- 2020 (Q3): 30.7 percent
- 2012 (Q1): 23.8 percent
- 2008 (Q4): 23.7 percent
- 2009 (Q4): 23.4 percent
- 2013 (Q2): 22.7 percent
- 2011 (Q4): 22.5 percent
- 2014 (Q3): 22 percent
- 2007 (Q3): 21.5 percent
- 2011 (Q3): 21.5 percent
- 2010 (Q1): 21.2 percent
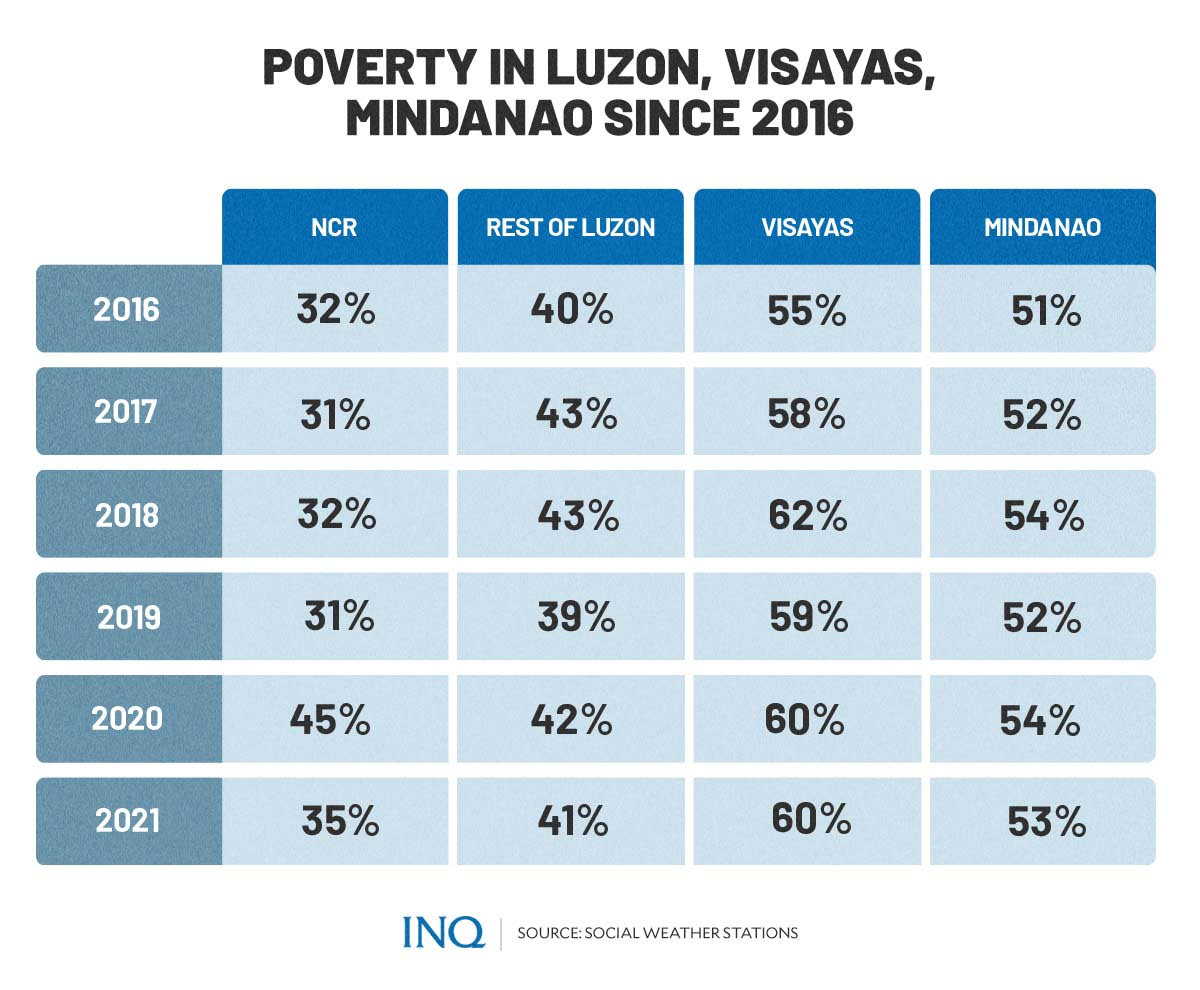
Poverty
Mangahas said that while poverty and hunger are different, they are related, adding that not all of the poor go hungry, although it is more common for them to go hungry than those who rate themselves as not poor.
GRAPHIC: Ed Lustan
As seen by INQUIRER.net, the rate of Filipino households considered as “poor” was high when severe hunger is prevalent:
- November 1998: 59 percent
- March 2000: 59 percent
- April 2000: 60 percent
- March 2001: 59 percent
- December 2008: 52 percent
- March 2012: 55 percent
- May 2012: 51 percent
- June 2013: 49 percent
- November 2020: 48 percent
Mangahas said that from one quarter to the next, hunger rates, among both the poor and the non-poor, change.
GRAPHIC: Ed Lustan
He said that from third quarter 2021 to fourth quarter 2021, hunger among the poor rose by over 3 percentage points, from 14.3 percent to 17.6 percent, while hunger among the non-poor rose by 1 percentage point, from 6.5 percent to 7.5 percent.
Mangahas said that out of the four SWS survey areas, Metro Manila often has the most hunger and the least poverty at the same time, explaining that families in the metropolis have much less opportunity to grow or raise their own food at home.
In quarter four 2021, Metro Manila had 22.8 percent hungry and 25 percent poor; the rest of Luzon had 9.2 percent hungry and 41 percent poor; Visayas had 9.7 percent hungry and 60 percent poor; while Mindanao had 12.2 percent hungry and 43 percent poor.


