Teaching math through exercise

Heart disease
Show the class the video clip “Understanding Heart Disease” (www.youtube.com/watch?v=3cW8_wFXDA). Afterwards, discuss ways to prevent heart disease, with some guide questions:
Which heart diseases are shown in the video clip?
What causes heart disease?
How does understanding heart disease help us?
Discuss ways to prevent heart disease, such as controlling blood cholesterol level and blood pressure, and preventing diabetes; avoiding tobacco use, moderating alcohol intake, maintaining a healthy weight and diet, and engaging in regular physical activity.
Heart rate
Article continues after this advertisement
Our heart rate at rest is the number of beats per minute (bpm) when we are not exerting ourselves. This rate varies from a low of 40 to a high of 100 beats per minute. Men average 70 bpm, women, 75 bpm.
Our exercise rate depends on the intensity of the exercise, target rate and age. Our target rate results from sustained physical activity. To get the target rate, subtract age from 220, and then multiply by 0.75. For example, if a student is 17 years old, then subtract 17 from 220 to get 203, and then multiply by 0.75 to get 152.25 bpm, which is his target rate.
Teach students how to take their pulse. To take the carotid pulse at the neck, place the first two fingers on either side of the neck, taking care not to press too hard, and then count the number of beats for a minute.
Or take the radial pulse at the wrist. Place together the index and middle fingers of one hand on the opposite wrist, about 1/2 inch on the inside of the joint, in line with the index finger. Once the pulse is found, count the number of beats within a minute. (For more details, go to www.topendsports.com/testing/heart-rate-measure.htm.)
Now it’s time to run!
Running
Divide the class into groups for the running activity. Athletes can be in one group, average runners in another, and beginners in a third group.
Each group will complete a chart, list members’ ages, heart rates at rest (beats per minute), target rates. After running 100 meters, they should calculate their exercise rate (measuring their pulse), the time it takes them to run 100 meters, and then the rate to finish the 100 meters.
Recall that rate is just distance divided by time, so if a student finishes 100 meters in 0.36 minutes, his rate is 100/0.36, which is 277 meters per minute.
For instance, a table with three students can look like this:
Age Heart Rate at Rest in BPM Target Rate in BPM
Exercise Rate after running 100 meters Time (in minutes) to finish 100 meters Rate for 100 meters (in meters per minute)
17 80 152.25 142 0.36 277
16 69 153 136 0.35 286
18 64 151.5 112 0.32 312.5
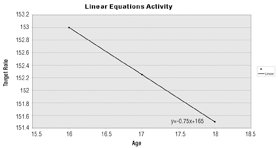
Graph the data. Choose two variables, say age and target rate. The graph should look like this:
Many of the points can be described by a straight line, and students can readily find the equation y = -0.75x + 165, where y is the target heart rate and x is age. From this linear equation, target rate can be predicted from age. For example, if a student is 20 years old, then his target rate is -0.75 (20) + 165 = 150 bpm.
The slope, which is -0.75, is negative, which means that the target heart rate and age have an inverse relationship. As age goes up, the target rates go down, and vice versa.
Explore different relationships among the other variables, such as age and exercise rate, or exercise rate and time to finish 100 meters.
Discussion
Guide the class in analyzing the data. Following are some guide questions:
Which relationships may be considered linear?
Answer: Age and target rate, since most of the points lie on the line. A line is enough to connect most of the points.
What is the relationship between the line and the equation displayed?
Once you are given a (geometric) line, an (algebraic) equation can be made. Once an equation is given, a line can be drawn.
How else can we use the equation?
The equation can be used to predict results. For example, when the age of a student is 20 years, we can predict that his target heart rate is 150 bpm.
Since we are interested in getting the relationships between two quantities, it is useful to do a model to understand and appreciate better the relationship.
A linear equation is a simple model and, as the lesson progresses, students will learn more about other models, such as quadratic, polynomial, exponential, trigonometric and other equations.
Math is a model that can be used to explain relationships in the real world. Math can also help us exercise smartly.
E-mail Darwin Closa at [email protected].
E-mail the author at [email protected].